Last reviewed: November 2026. We review this guide every year.
The short answer: The average IQ score is 100. IQ tests are scored so that about two in three children land between 85 and 115, the average range. A score shows how your child did against children their own age on one day. It is not a fixed measure of how clever they are, and it can shift on a retest.
Key takeaways
- An IQ score is a rank among children the same age, not a percentage of questions answered correctly.
- On the WISC-V, the most widely used children’s IQ test, scores from 90 to 109 are labelled “Average”.
- Scores before age 7 are a weak guide to later ability, and practice alone can add about 5 points on a retest.
- Every score carries a margin of error of about 5 points either way.
- No online quiz produces a real IQ score (how to spot an unreliable one). Formal testing is done one-to-one by a psychologist.
What does IQ stand for?
IQ stands for intelligence quotient. An IQ score sums up how a child reasons, remembers, understands language and processes information, compared with other children the same age.
The name comes from the original scoring method: a child’s “mental age” divided by their actual age, multiplied by 100. Modern tests dropped that formula. Today a child’s raw score is compared with a large sample of children their age and converted to a scale where the average is 100 (Farmer, 2020).
For children aged 6 to 16, most psychologists use the Wechsler Intelligence Scale for Children, Fifth Edition (WISC-V). It gives one overall number, the Full Scale IQ, plus five index scores: verbal comprehension, visual spatial, fluid reasoning, working memory and processing speed (Smart Kids with LD). For how the test runs, how long it takes and sample questions, see our guide to what an IQ test is.
What is the average IQ score?
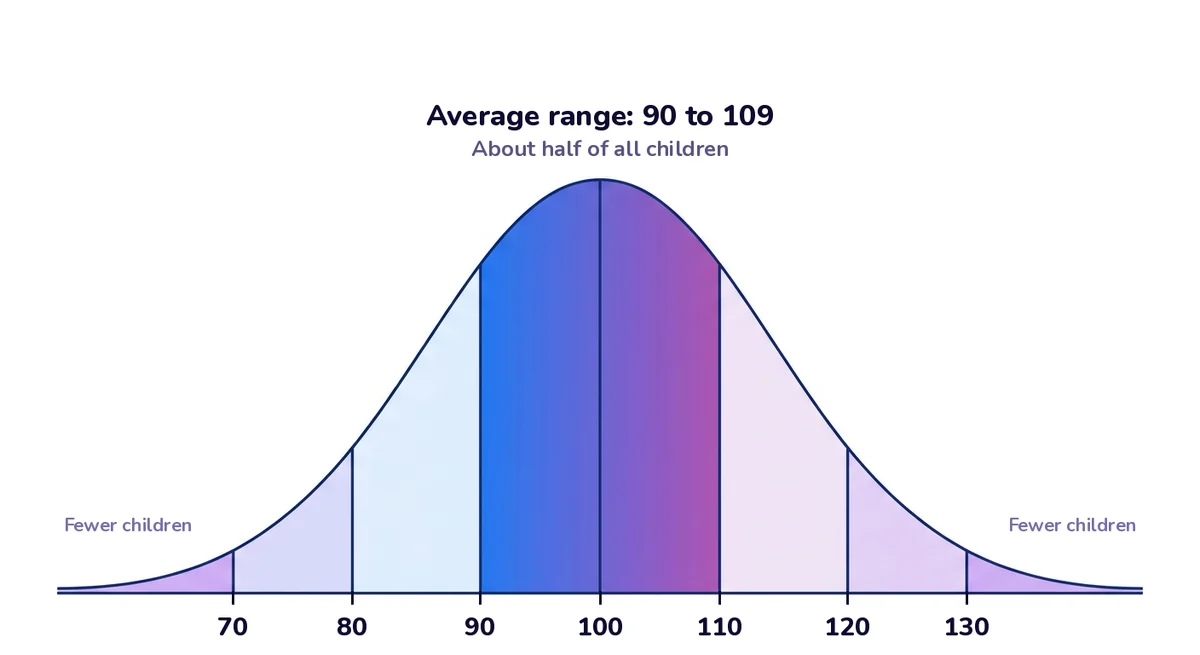
The average IQ score is 100 at every age, because the tests are built that way. Scores spread along a bell curve with a standard deviation of 15 points, so about 68% of people score between 85 and 115, and about 95% between 70 and 130 (Farmer, 2020).
That makes “average” a wide band. A child on 92 and a child on 108 are both in the average range, even though 16 points sounds like a big gap.
The average also has to be reset now and then. A 2015 meta-analysis of almost 4 million people in 31 countries found raw scores rose by about 3 IQ points per decade between 1909 and 2013, a pattern called the Flynn effect (our IQ test guide explains what it tells us about intelligence). The gains have slowed in recent decades (Pietschnig & Voracek, 2015). Publishers re-standardise their tests so that 100 always means today’s average. It’s also why a score from an old edition of a test can come out higher than the same child would score on the current one.
What do the IQ ranges mean?
IQ ranges are descriptive bands, not diagnoses. The table shows the WISC-V labels for each IQ level and roughly how many children fall in each band.
| IQ Range | WISC-V Description | Share of Children (approx.) | Percentile |
|---|---|---|---|
| 130 and above | Extremely High | 2% | 98th and above |
| 120–129 | Very High | 7% | 91st-97th |
| 110–119 | High Average | 16% | 75th-90th |
| 90–109 | Average | 50% | 25th-73rd |
| 80–89 | Low Average | 16% | 9th-23rd |
| 70–79 | Very Low | 7% | 2nd-8th |
| 69 and below | Extremely Low | 2% | Below 2nd |
Labels from the WISC-V. Shares and percentiles worked out from the bell curve (average 100, standard deviation 15).
Older reports may use earlier labels for the same bands, such as “Superior” for 120–129 and “Borderline” for 70–79 (Smart Kids with LD).
Two points on the scale come up most often. Giftedness is often defined as a score more than two standard deviations above average, which is 130 (Farmer, 2020). At the other end, a score of around 70, or as high as 75, is one part of identifying an intellectual disability. It only counts alongside real difficulty with everyday conceptual, social and practical skills, starting before age 22 (AAIDD). A number on its own never decides it.
What does your child’s IQ test score actually mean?
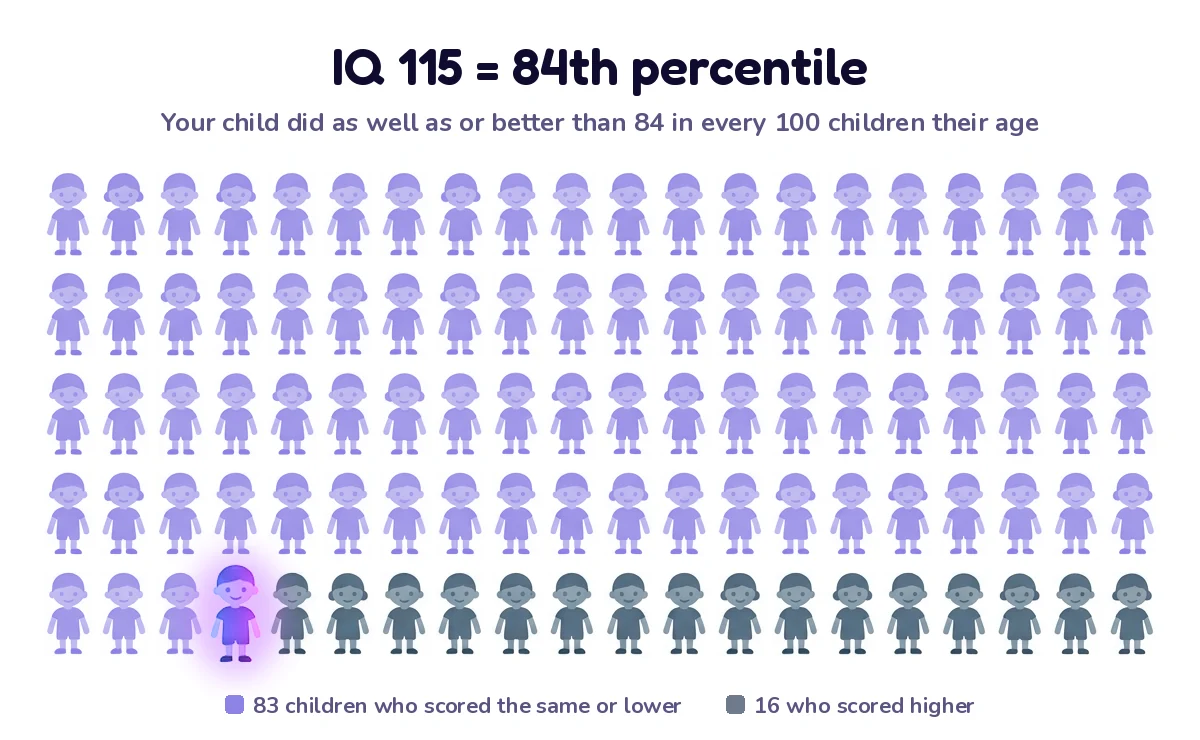
Your child’s IQ test score shows where they ranked among children their age on the day of the test. It’s a comparison, not a mark out of 100.
It’s a percentile, not a percentage
A score of 115 doesn’t mean your child got 115 of anything right. It puts them at about the 84th percentile: they did as well as or better than 84 in every 100 children their age.
Every score comes with a margin of error
No test measures perfectly, so a psychologist’s report gives a range, called a 95% confidence interval, beside each score. In Pearson’s sample WISC-V report, a Full Scale IQ of 97 comes with an interval of 91 to 103 (Pearson sample report). Read the range, not just the number.
The five index scores tell you more than the total
The Full Scale IQ combines the five index scores, so it only means much when they’re fairly even. A child who is strong verbally but weaker on visual-spatial tasks can end up with an “average” total that hides both. Gaps of about 10 points between index scores are common. Bigger gaps are worth raising with the psychologist, because they can point to a specific learning difficulty, attention difficulties or skills maturing at different rates (Smart Kids with LD).
What I look for as a teacher
[Check this matches your experience, or replace it with your own example.] When a parent shows me a report, I look past the big number to working memory and processing speed. Those two scores often explain what I’ve already noticed in lessons: the child who follows the explanation but loses the instructions halfway through, or who knows the answer but runs out of time. That’s where practical help starts.
Can a child’s IQ score change?
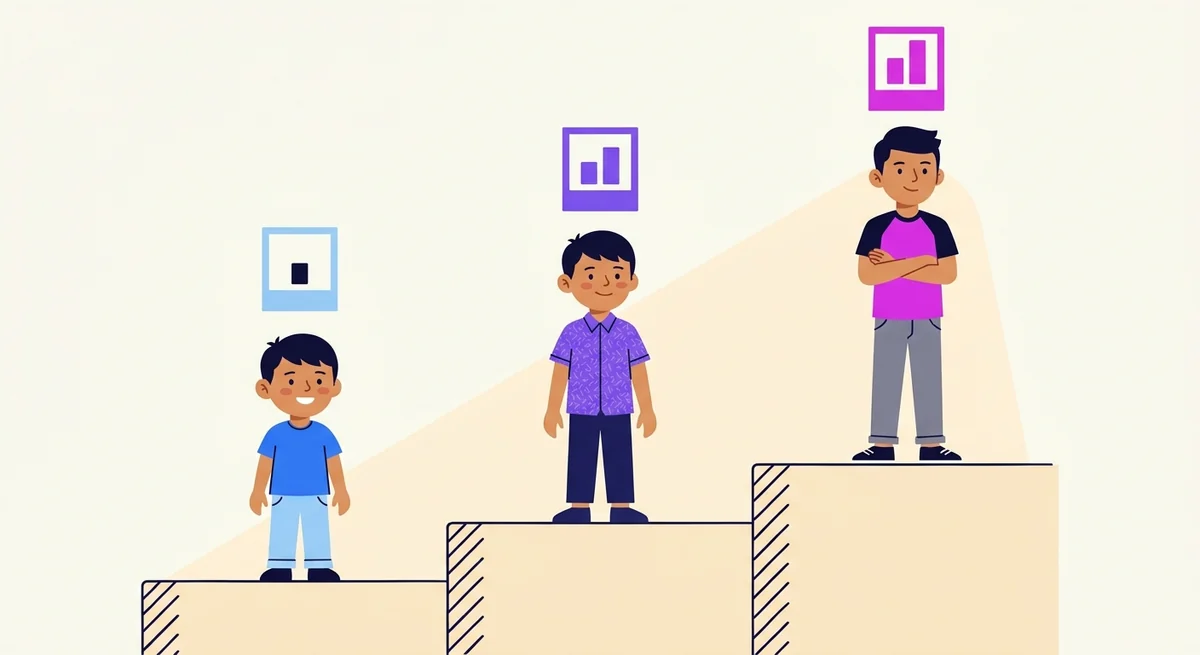
Yes, and the younger the child, the more it can move. A 2024 meta-analysis of 205 longitudinal studies and 87,408 people found that IQ scores are only moderately stable in young children and highly stable from adolescence onwards. By the authors’ estimate, scores are stable enough to base decisions about an individual child on only from about age 7, and then only over short periods (Breit et al., 2024).
Three things move a child’s score:
- Development. Children’s abilities grow at different speeds, so their ranking shifts as they grow.
- School. A 2018 meta-analysis of 42 datasets and more than 600,000 people found that each extra year of education added roughly 1 to 5 IQ points, and the gain lasted (Ritchie & Tucker-Drob, 2018).
- Practice. Taking the same kind of test again raises scores by about a third of a standard deviation, around 5 IQ points, without any change in ability. The gains level off after the third attempt (Scharfen et al., 2018).
One thing that doesn’t move it is brain training. Large reviews find no effect on IQ once studies use proper comparison groups, as our post on whether brain training works explains.
Does a high IQ mean better grades?
It helps, but it explains less than most parents expect. A 2015 meta-analysis of 240 samples and 105,185 students found a correlation of .44 between IQ and school grades, or .54 after correcting for measurement error (Roth et al., 2015). Even the higher figure leaves around 70% of the differences in grades unexplained by IQ, which leaves plenty of room for effort, teaching, reading habits, and sleep.
The link was weaker in primary school than in secondary (.40 against .46), and stronger for maths and science than for languages.
What should you do with your child’s IQ score?
Use it to understand your child’s strengths and needs, not as a label. Here’s what I’d suggest to any parent holding a report:
- Ask for the index scores and confidence intervals, not just the Full Scale IQ.
- Compare it with what teachers see. A report that doesn’t match the child in the classroom is worth talking through with the psychologist.
- Act on specific skills. A low working memory score, for example, points to concrete help, such as giving instructions one step at a time. For practice at home, our free worksheets cover both working memory and processing speed, and two of our brain games train the same skills: Span Ladder for working memory and Colour Clash for processing speed.
- Don’t retest too soon. Ask the psychologist when a retest makes sense.
In Malaysia, a formal IQ assessment should be done by a registered clinical psychologist. Our guide to what an IQ test is explains how to check their registration and what to ask before booking.
Where EyeQBoost fits: our free assessment isn’t an IQ test, and we don’t give IQ scores. [Check this matches your assessment.] It looks at the specific skills behind schoolwork, such as reading, attention and visual processing, and shows you what to work on next. Read more on our Academic Excellence programme.

Frequently asked questions
What is the average IQ for a 10-year-old?
It’s 100, the same as at every age. Each child is compared only with children of their own age, so a 10-year-old’s score is ranked against other 10-year-olds. A 10-year-old does answer more questions correctly than a 6-year-old, but that difference is built into the age norms. That’s why a score of 100 means “average for your age” whether your child is 6 or 16.
What is a good IQ score for a child?
Any score from 90 to 109 is in the average range, which covers about half of all children. Scores from 110 to 119 are high average. “Good” depends on what the score is for. For everyday learning, the pattern of strengths and weaker areas in the report tells you far more than whether the total sits a few points above or below 100.
Is an IQ of 120 gifted?
Not by the most common definition. A score of 120 is in the “Very High” band, around the 91st percentile, so your child scored as well as or better than about 91 in 100 children their age. Giftedness is often defined as 130 or above, roughly the top 2%. Programmes set their own cut-offs, though, so check the criteria of any programme you’re applying to.
Does a low IQ score mean my child has a learning disability?
No. A specific learning difficulty, such as dyslexia, often appears in children whose overall IQ is average or above. What psychologists look for is a pattern, such as reading well below what the child’s other scores would predict. If your child’s report shows large gaps between index scores, ask the psychologist what those gaps mean and what support would help.
How should teachers use a pupil’s IQ report?
Use the recommendations and the index scores, not the headline number. A low working memory or processing speed score tells you how to adjust your teaching: shorter instructions, more time, written steps to refer back to. Check the report against what you see in class, and treat scores from children under 7 as provisional. A single number shouldn’t decide a child’s set or group.
Want to know which skills sit behind your child’s results?
References
- AAIDD. (n.d.). Defining criteria for intellectual disability. American Association on Intellectual and Developmental Disabilities.
- Breit, M., Scherrer, V., Tucker-Drob, E. M., & Preckel, F. (2024). The stability of cognitive abilities: A meta-analytic review of longitudinal studies. Psychological Bulletin, 150(4), 399–439. https://doi.org/10.1037/bul0000425
- Farmer, C. (2020). Intelligence quotient. In F. Volkmar (Ed.), Encyclopedia of Autism Spectrum Disorders. Springer. https://doi.org/10.1007/978-1-4614-6435-8_1642-3
- Pearson. (2014). WISC-V score report: sample.
- Pietschnig, J., & Voracek, M. (2015). One century of global IQ gains: A formal meta-analysis of the Flynn effect (1909–2013). Perspectives on Psychological Science, 10(3), 282–306. https://doi.org/10.1177/1745691615577701
- Ritchie, S. J., & Tucker-Drob, E. M. (2018). How much does education improve intelligence? A meta-analysis. Psychological Science, 29(8), 1358–1369. https://doi.org/10.1177/0956797618774253
- Roth, B., Becker, N., Romeyke, S., Schäfer, S., Domnick, F., & Spinath, F. M. (2015). Intelligence and school grades: A meta-analysis. Intelligence, 53, 118–137. https://doi.org/10.1016/j.intell.2015.09.002
- Scharfen, J., Peters, J. M., & Holling, H. (2018). Retest effects in cognitive ability tests: A meta-analysis. Intelligence, 67, 44–66. https://doi.org/10.1016/j.intell.2018.01.003
- Smart Kids with LD. (n.d.). Understanding IQ test scores.
About the author: Reuben Bykersma is the Catalyst and co-founder of EyeQBoost, a holistic education company helping children thrive in school and beyond, not just in exams. He has been teaching since the age of 15. He co-built a tutoring academy that taught more than 200 students over five years, and has taught English at a private school. Today he is building EyeQBoost to bring research-informed learning to more students, and to give parents and teachers honest, practical tools to support them. His aim is to make a lasting difference in education for students, teachers and parents alike. Connect on LinkedIn